
Algorithm updates & visibility
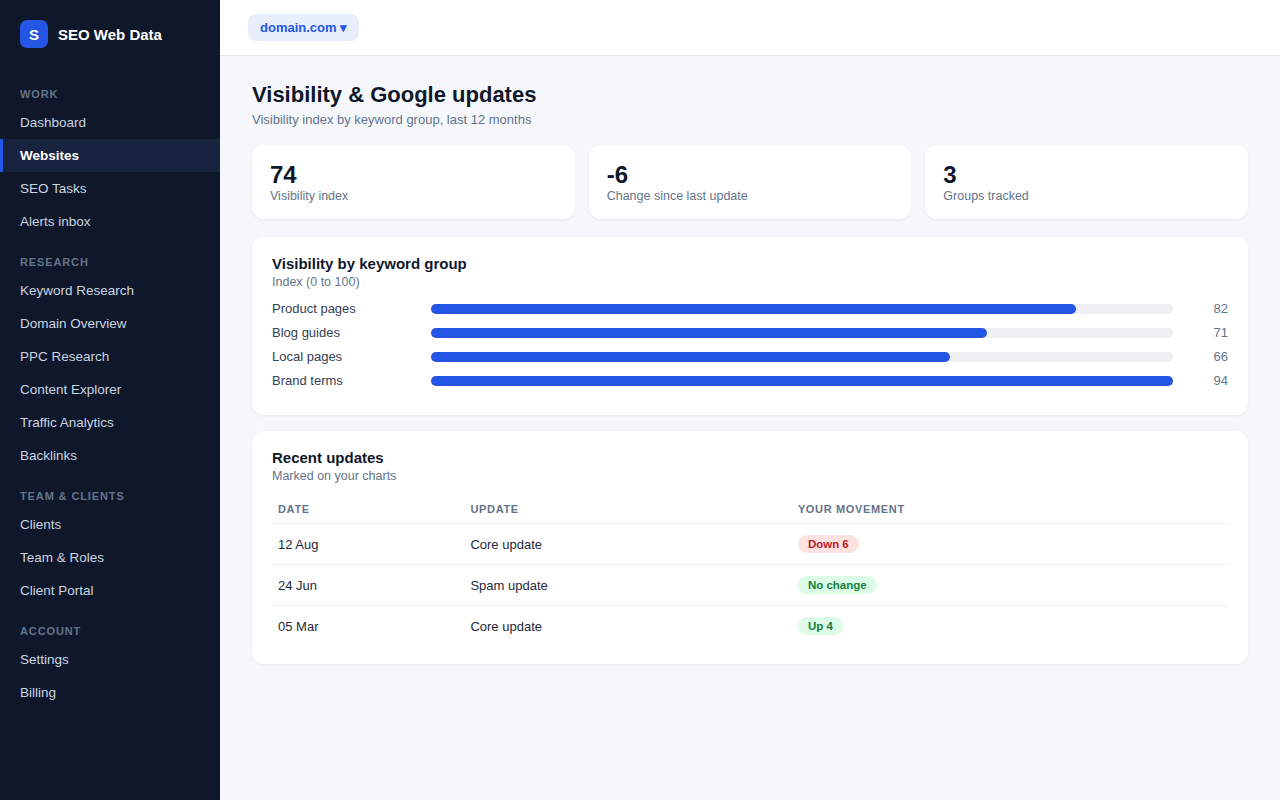
When traffic suddenly moves, the first question is whether it was you or Google. This marks known update dates on your charts and shows how each group of your keywords was doing around them.
What's included
- Known Google update dates marked on your charts
- A visibility index for each keyword group
- Alerts when visibility moved noticeably around an update
Group your tracked keywords by topic, then see each group’s visibility over time with update markers on the same chart. You can see at a glance whether a group dropped after a core update while others held steady.
Add your own notes to the chart — for example when a new menu or site design launched — so you can tell your own changes from Google’s. Where there is enough data you also get a share of voice for each group, which is handy for reports.
How it works
Visibility is an estimate built from where your tracked keywords rank and typical click rates for those positions, so it is best used to see direction and compare groups. Update dates come from a maintained list. If a group moved noticeably around an update, an alert is raised so you do not have to check the chart yourself.
Why this matters
- Faster diagnosis — rule out your own changes or confirm a wider shift before you start rewriting pages.
- Topic-level clarity — see which parts of your site gained or lost, not just one number.
- Client-ready — a simple visibility figure and annotated chart make updates easy to explain.
What it does not do
The visibility index is this platform’s own estimate, not a Google metric. An alert near an update date shows timing, not cause. It does not tell you what Google changed, and it is wise to wait until an update finishes rolling out before making big changes.
Works with the rest of the platform
It reads the rankings from automated keyword tracking and sends alerts to your alerts inbox. Compare pages with search result snapshots after a drop.
Frequently asked questions
Is the visibility index a Google metric?
No. It is an estimate based on your positions and typical click-through rates, so it is best used for trends.
Do I need to set anything up?
Group your tracked keywords. After that, update markers and visibility appear on their own.
Can I add my own events to the chart?
Yes. Add notes such as a site relaunch so you can separate your changes from Google’s.
Should I react straight away to a drop?
Usually not. Wait until an update has finished rolling out, then compare the affected pages with the ones now ranking above you.